Small Ethnicity Regions in AncestryDNA: When They Don’t Mean What You Think
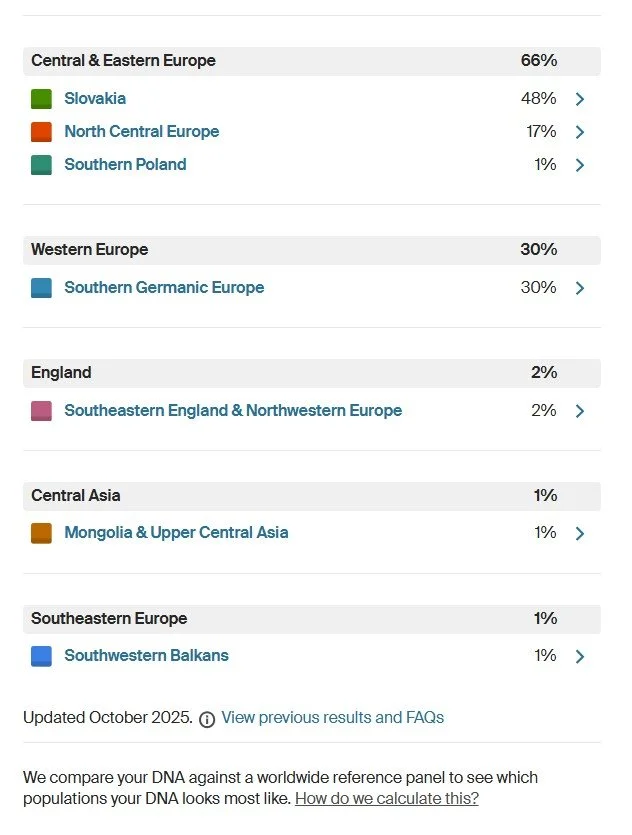
If you’ve tested with AncestryDNA, you’ve likely seen a result that looks very precise at first glance. Your ethnicity estimate is broken into regions, often down to specific subregions, and then at the bottom there are very small values. These are typically listed as 1%, 2%, 3%, or sometimes even “<1%.” In the example shown below, you can see regions like Southwestern Balkans and Mongolia and Upper Central Asia. These are the results that tend to generate the most questions, but they are also the least reliable.
It is important to be clear about what you are looking at. These are ethnicity regions, not identified ancestors. According to Ancestry, ethnicity estimates are based on comparing your DNA to reference populations and are calculated using statistical models. They are explicitly described as estimates, not exact values, and they can change over time as more data is added and methods improve.
A common assumption is that a small percentage must map to a single distant ancestor. In reality, DNA inheritance does not work that cleanly. While you have a fixed number of ancestors in each generation, the DNA you inherit from them becomes increasingly uneven as you go back in time. Ancestry’s own support documentation notes that you may not inherit DNA from every ancestor, especially as you move further back, which makes it difficult to connect a small percentage to a specific person in your tree.
This is explained clearly in this YouTube video by Andy Lee:
In his example, he walks through what it would take to explain a 2% ethnicity region. To even begin to account for that percentage, you would need to look at ancestors in the range of your 3rd, 4th, 5th, and even 6th great-grandparents. At that point, you are dealing with hundreds of individuals in your family tree, and the timeline stretches back as far as roughly 300 to 320 years.
That creates a practical problem. Even if the estimate were perfectly accurate, you would still need to identify one or more ancestors among hundreds of possibilities across multiple generations to explain it. As genealogists know, records become less complete, less consistent, and more difficult to access the further back you go. In many cases, especially in the United States, reliable documentation begins to thin significantly before the mid-1800s. For some communities, including those affected by slavery, it can be extremely difficult to trace ancestry beyond the Civil War era and the 1860s. That makes it even less realistic to use a 1–2% ethnicity region as a starting point for identifying a specific ancestor.
There are also technical limitations in how these ethnicity regions are generated. Ancestry’s documentation and white paper explain that ethnicity estimates rely on statistical comparisons and that many populations share overlapping genetic patterns. This overlap makes it difficult to distinguish between regions at very small percentages. Their materials also state that results are updated over time as the reference panel grows, which means smaller percentages are the most likely to shift, merge into other regions, or disappear entirely in future updates. (You may have even seen your ancestral regions change when updates come out!)
For these reasons, small ethnicity regions should be treated with caution. A widely accepted guideline, consistent with Ancestry’s own explanations, is that very small percentages are less reliable and should not be interpreted as definitive evidence on their own. They are better understood as tentative signals rather than conclusions. They can suggest possibilities, but they do not provide enough precision to identify an ancestor, a time period, or even a specific side of your family.
There is one important exception. Small ethnicity regions can become meaningful when they are supported by strong evidence. If you have a well-documented tree that extends multiple generations, and you see consistent patterns in your DNA matches that point to the same region, then a small percentage may help confirm what you already suspect. However, it should not be used to build a theory in the first place. Andy Lee in his video referenced earlier suggests to ignore regions of less than 5%, unless you have this well documented tree.
The key takeaway is that ethnicity regions, especially at very small percentages, are not the same as genealogical evidence. They are estimates based on population comparisons, and their accuracy decreases as the percentage gets smaller. If your goal is to answer real family history questions, your focus should remain on records, documented relationships, and DNA matches. That is where reliable answers come from.
Ancestry References:
https://support.ancestry.com/s/article/AncestryDNA-Ethnicity?language=en_US
https://www.ancestry.com/c/dna-learning-hub/reading-your-ethnicity-estimate
https://www.ancestrycdn.com/support/us/2023/09/Ethnicity2023whitepaper.pdf