One of the things I've learned while writing and researching my true crime Western, The Solomon Gang: Outlaws by Any Name, is that different AI tools have different strengths. I've been experimenting with using Google's Gemini Notebook and ChatGPT together, particularly for organizing historical documents and turning complex research into something visual.
Recently, I used both tools to create an infographic about Jack Copeland's 1914 prison escape, the subsequent manhunt through Colorado, and two additional prison escape plots later that same year. The process worked remarkably well, although it took some editing to get the final result I wanted.
Organizing Historical Research with Gemini Notebook
My book research involves hundreds of historical newspaper articles, prison records, photographs, and other documents collected from multiple archives. Keeping track of the people, dates, locations, and overlapping events can be challenging, particularly when the same individuals used different names or appeared in newspaper reports that sometimes contradicted one another.
I've been using Gemini Notebook to organize and analyze this material. For my 1914 research, I created a notebook containing dozens of historical newspaper articles and other sources related to Jack Copeland's escape and the prison conspiracies that followed.
One of the things I like about Gemini Notebook is its ability to work with a collection of uploaded sources. I can ask questions across the documents, identify connections between events, and compare information from different newspaper accounts. It's particularly helpful when I'm editing chapters and want to revisit a specific detail without manually searching through dozens of files.
The tool also offers several ways to visualize information, including timelines, mind maps, slide decks, and infographics.
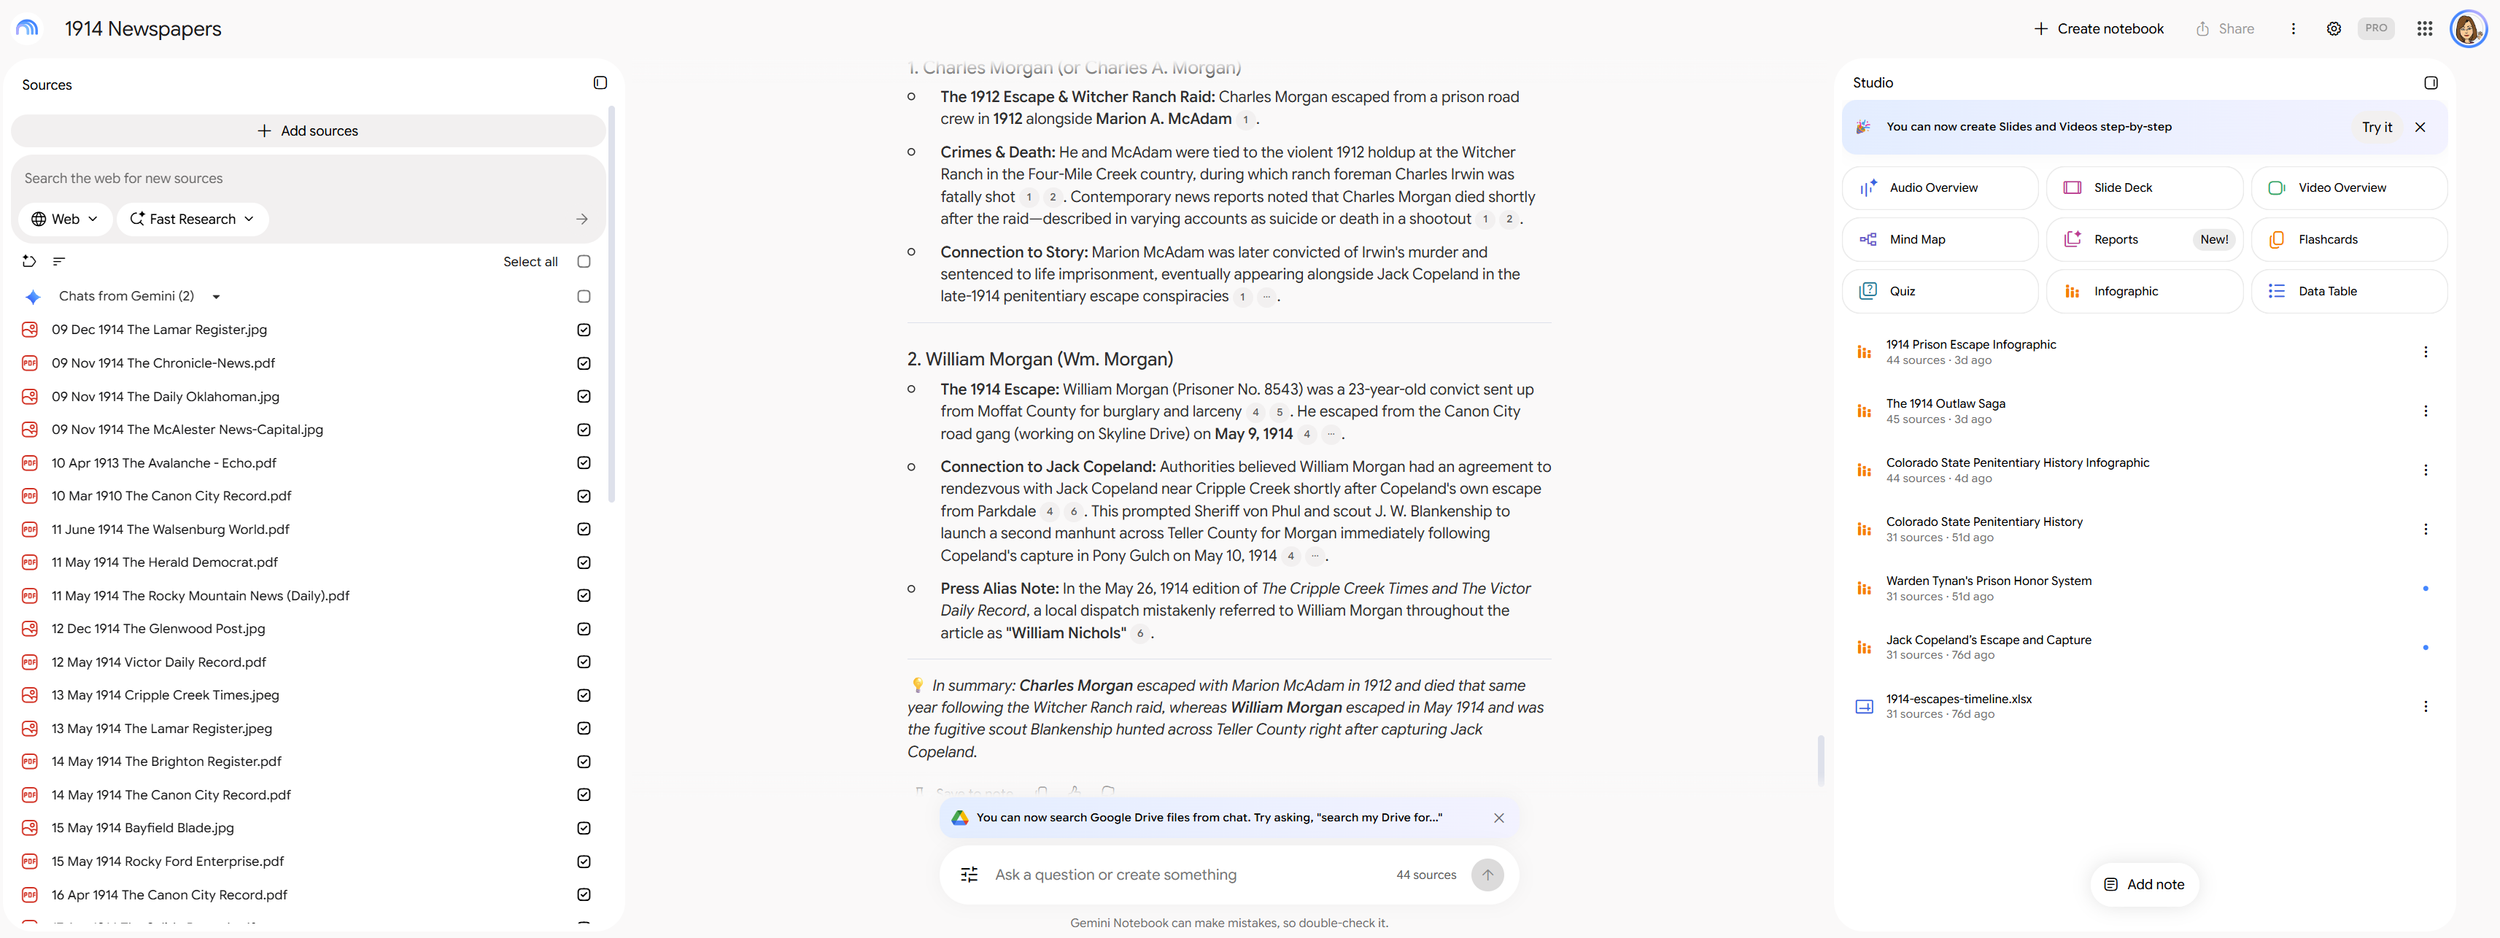
This is my 1914 Newspapers notebook in Gemini Notebook
Turning the Research into an Infographic
I decided to see whether Gemini Notebook could turn my 1914 research into a visual summary. Using the infographic feature, I generated an illustration showing three major parts of Jack Copeland's story: his April-May 1914 escape and manhunt, a November prison breakout conspiracy, and a second dynamite plot in December.
The initial result was impressive. Gemini organized the events into three illustrated columns with scenes depicting the escape, pursuit, recapture, and later prison plots. It was a creative way to summarize a complicated series of historical events that involved numerous individuals and locations.
However, the infographic had some problems.
The biggest issue was the text. There were considerable spelling errors throughout the infographic, including names and descriptions that needed correction. For a historical researcher, that's a significant problem. Names, dates, and locations need to be accurate, particularly when the graphic is based on documented events.
I also wasn't thrilled with the layout. Each column of illustrations followed a large, winding path that looked remarkably like the number "2." Once I noticed it, I couldn't unsee it! The design was interesting, but the oversized curves distracted from the actual story.
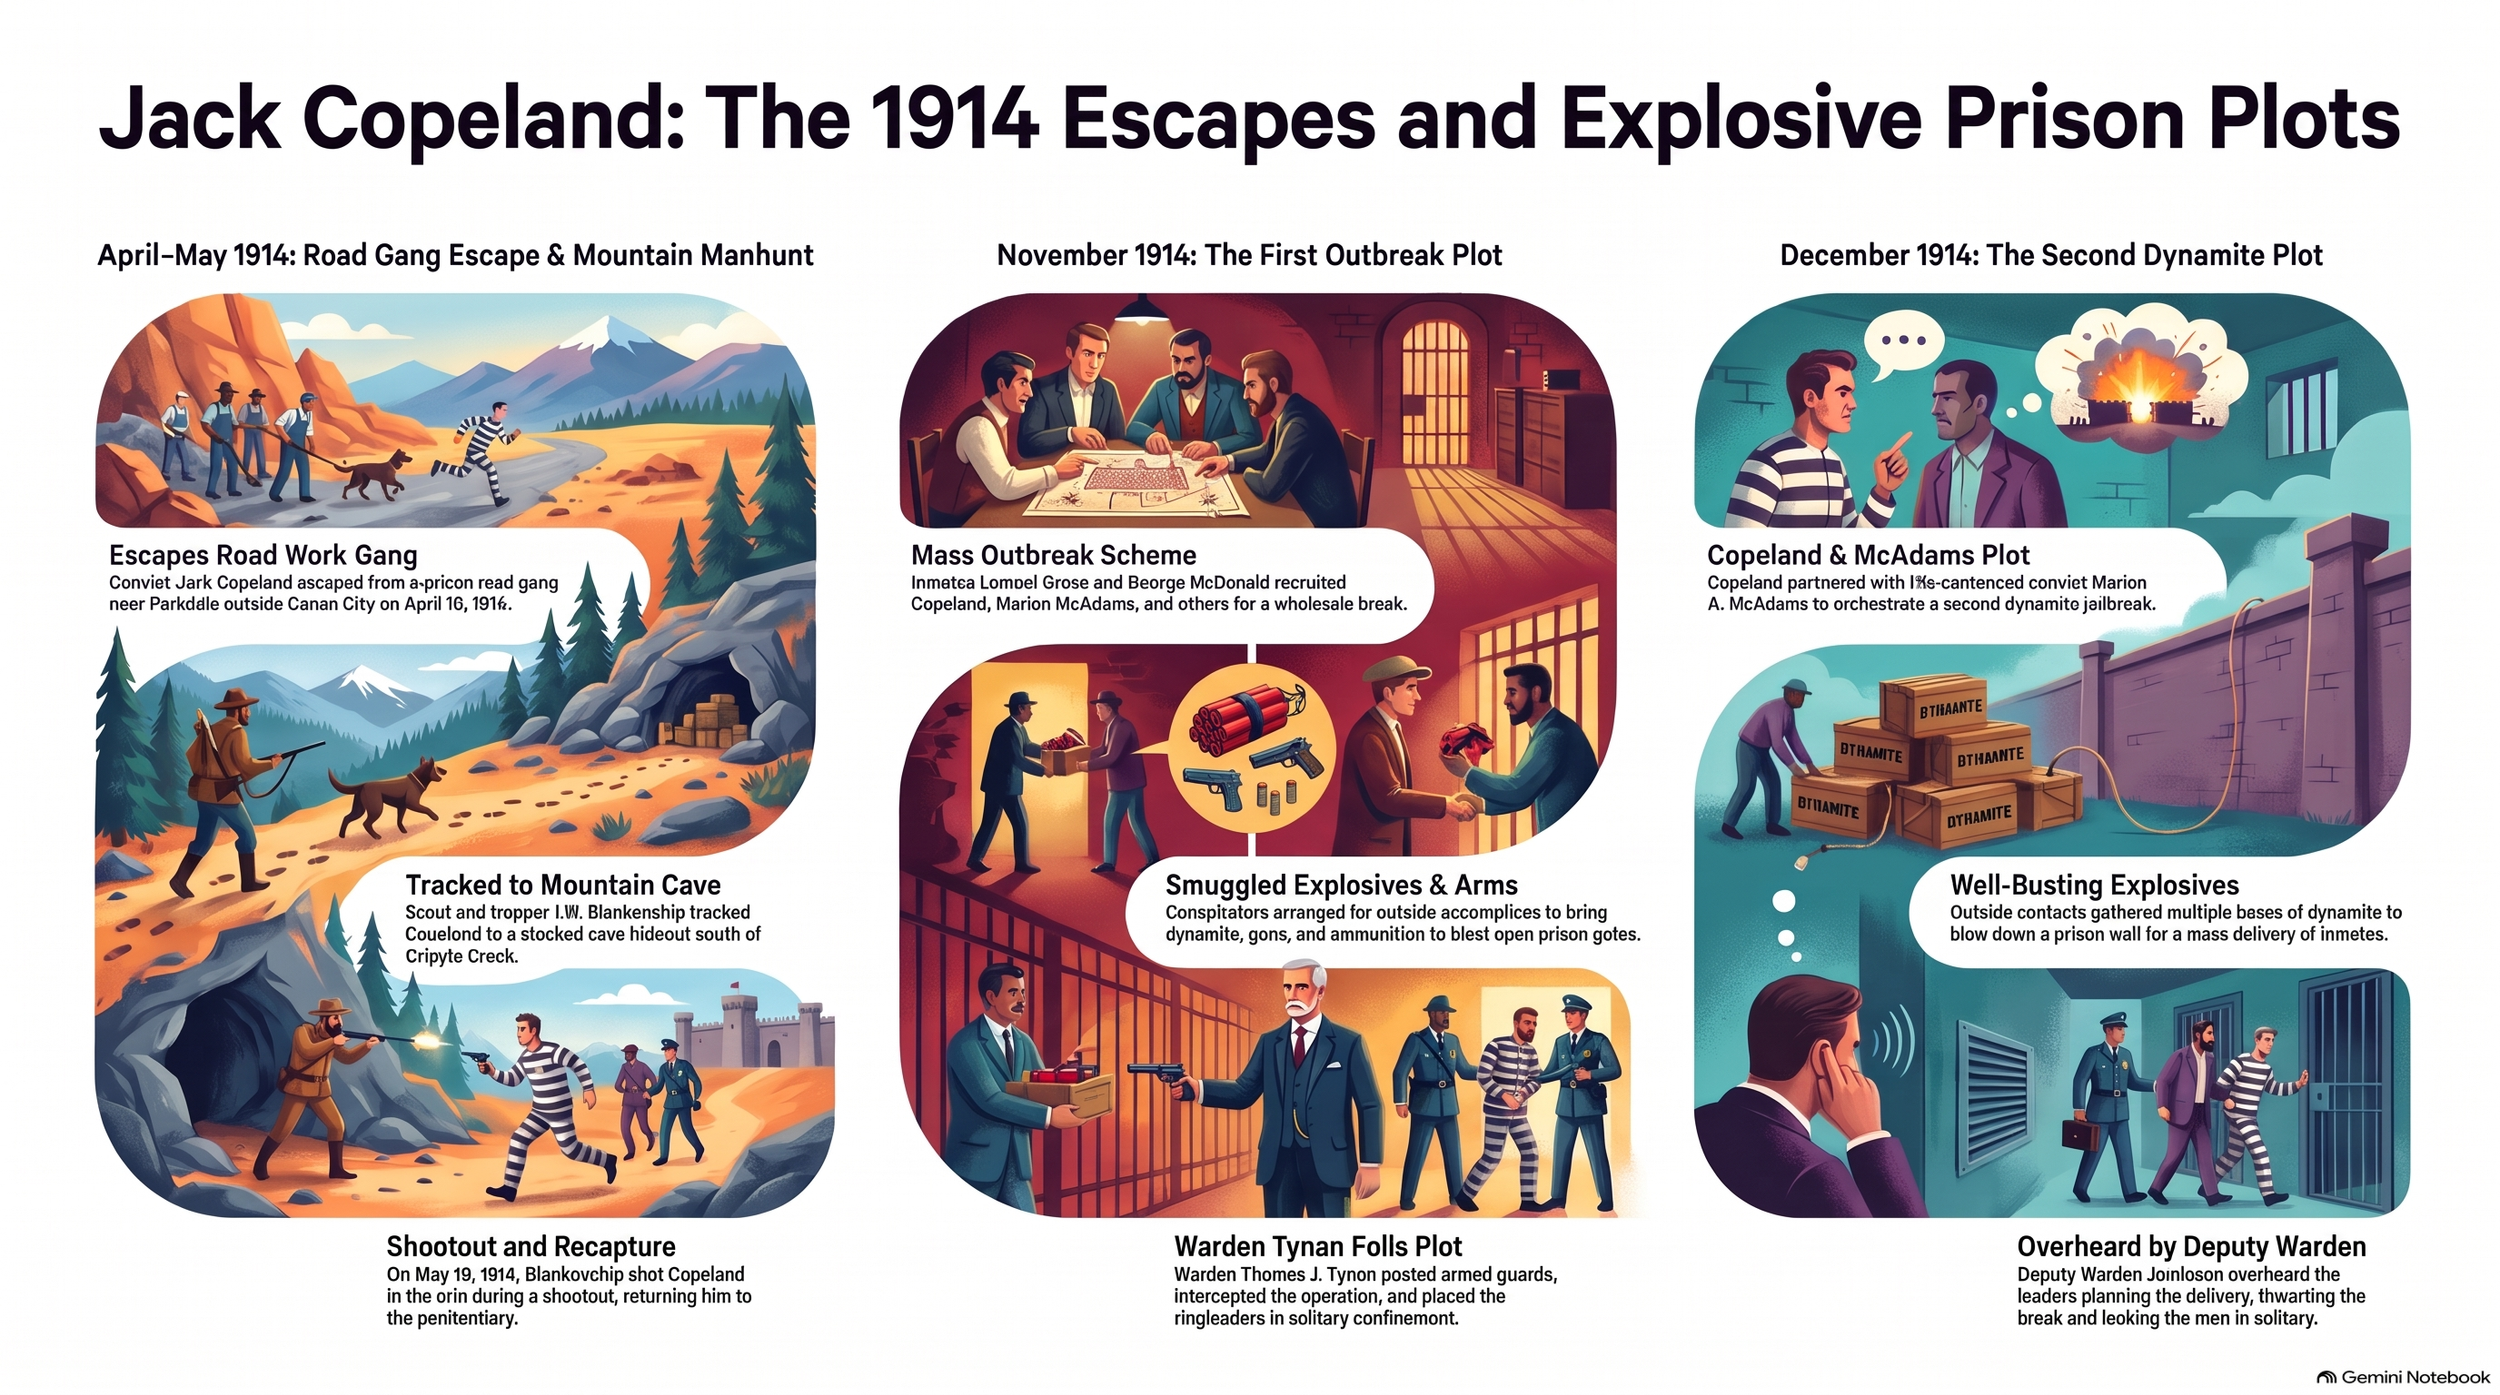
The original infographic produced by Gemini Notebook with considerable spelling errors
Using ChatGPT to Clean Up the Infographic
My first attempt was to use Gemini Chat to correct the infographic. Since Gemini Notebook had created the original image, I thought Gemini Chat might be the easiest way to fix the spelling errors and adjust the layout. Unfortunately, despite my instructions, it wasn't able to make the corrections I needed.
Rather than starting over, I downloaded the infographic and uploaded it into ChatGPT.
I asked ChatGPT to examine the image, correct the spelling, and clean up the overall presentation. I also uploaded my book manuscript so the names and historical details could be checked against my research.
This is an area where I still find ChatGPT particularly useful. In my experience, ChatGPT is better at understanding and editing images than Gemini, especially when I need to describe specific visual changes in ordinary language.
For example, I asked ChatGPT to correct the names, adjust the clothing so prisoners were shown in striped prison uniforms when appropriate, and change some of the scenes to better reflect the historical events. I also asked it to redesign the winding paths so the columns no longer resembled enormous number twos.
The result was a cleaner, more readable infographic that retained much of Gemini's original concept but better represented the material I was trying to communicate.
What I found particularly interesting was that Gemini Notebook did a good job organizing my source material and generating the initial infographic, but Gemini Chat struggled to edit its own image. ChatGPT was much more effective for the corrections I wanted, although I still needed to review the final result for historical accuracy.
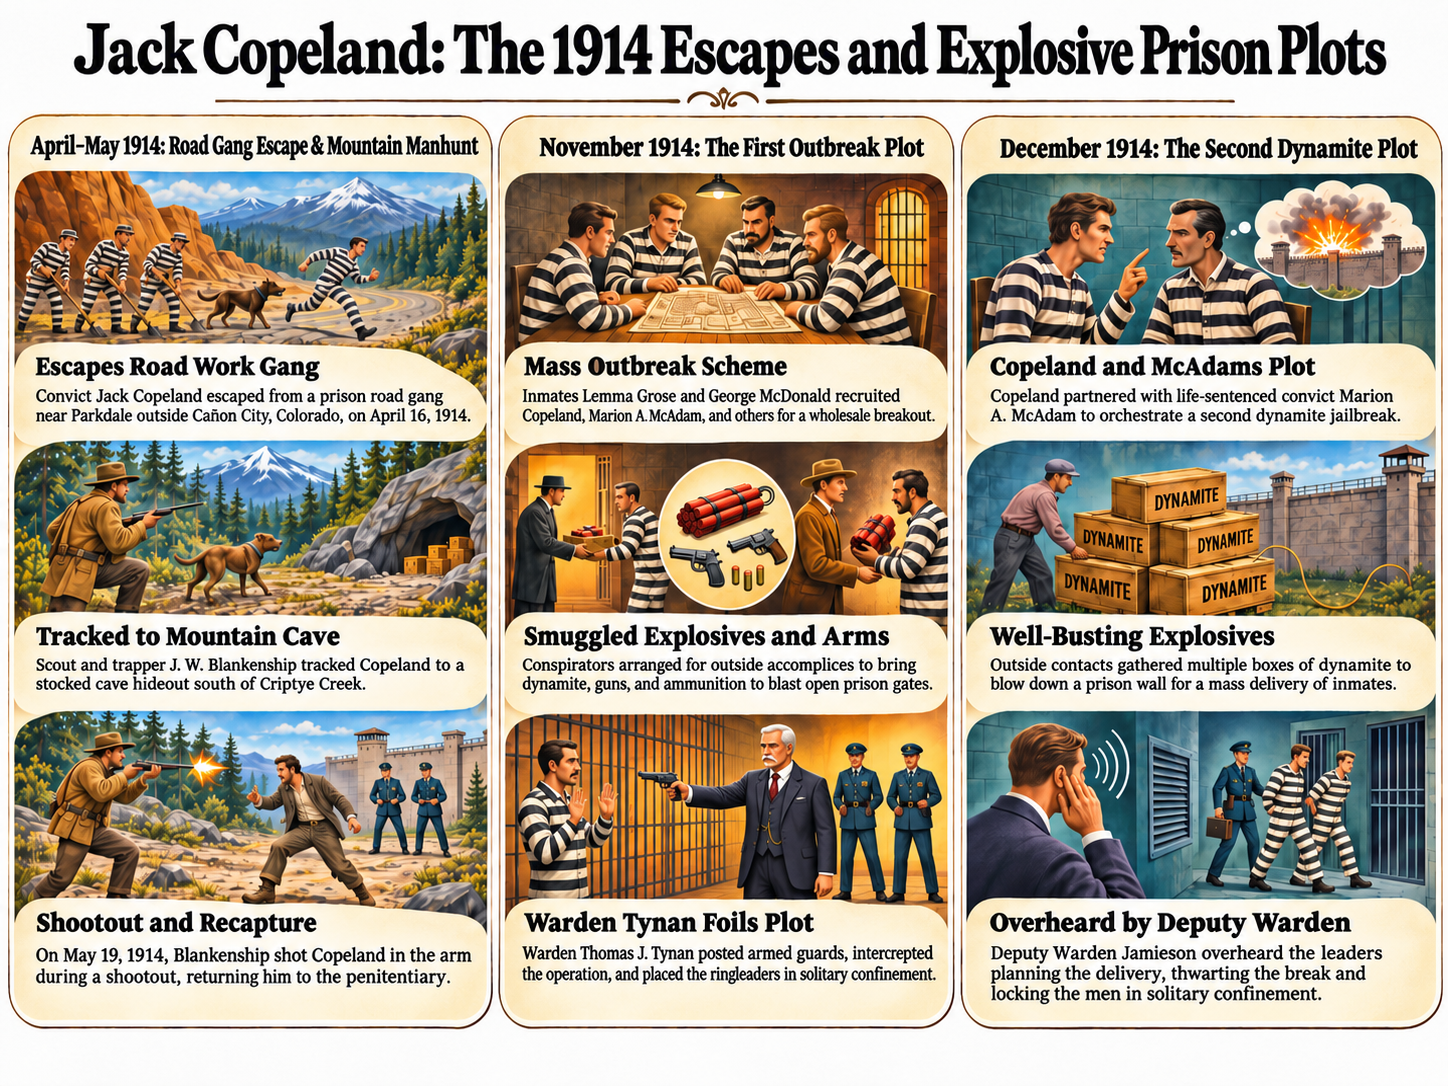
The final infographic from ChatGPT
Why I Like Using Both Tools
What I find interesting about this workflow is that I didn't need to choose one AI tool over the other. Each contributed something useful.
Gemini Notebook helped me work with a large collection of historical documents and generate the initial visual summary. ChatGPT provided another layer of image analysis and editing, allowing me to refine the design and correct problems without recreating the entire infographic manually.
Neither tool replaces historical research or careful fact-checking. AI-generated infographics can contain spelling errors, misidentified people, invented visual details, or incorrect interpretations of the underlying sources. Even after editing an image with ChatGPT, I still need to compare the finished graphic against the original records and my manuscript.
But as a way to make historical research more accessible and visually engaging, I think this combination has real potential.
For genealogists, the same approach could be used to illustrate family migrations, historical timelines, ancestral relationships, or important events in an ancestor's life. Start with your documented research, use AI to create a visual interpretation, and then carefully review and refine the results.
The key is treating AI as a research and creative assistant, not as the final authority on historical facts.
And sometimes, all it takes to improve an infographic is fixing a few names, correcting the historical details, and removing a couple of giant number twos!
Learn more about my research and the story behind Jack Copeland in The Solomon Gang: Outlaws by Any Name.
