Using ChatGPT Thinking Mode to Edit Historical Maps
I use AI constantly in genealogy, but not always in the way people expect. It is not just for writing summaries, organizing research notes, or analyzing records. Sometimes, the most useful AI task is much more practical.
For my book, The Solomon Gang: Outlaws by Any Name, I needed a map of Colorado showing the areas where my outlaw great-grandfather operated. I had downloaded a public domain map that fit the style and timeframe of the book, but I still needed to visually mark specific counties and regions.
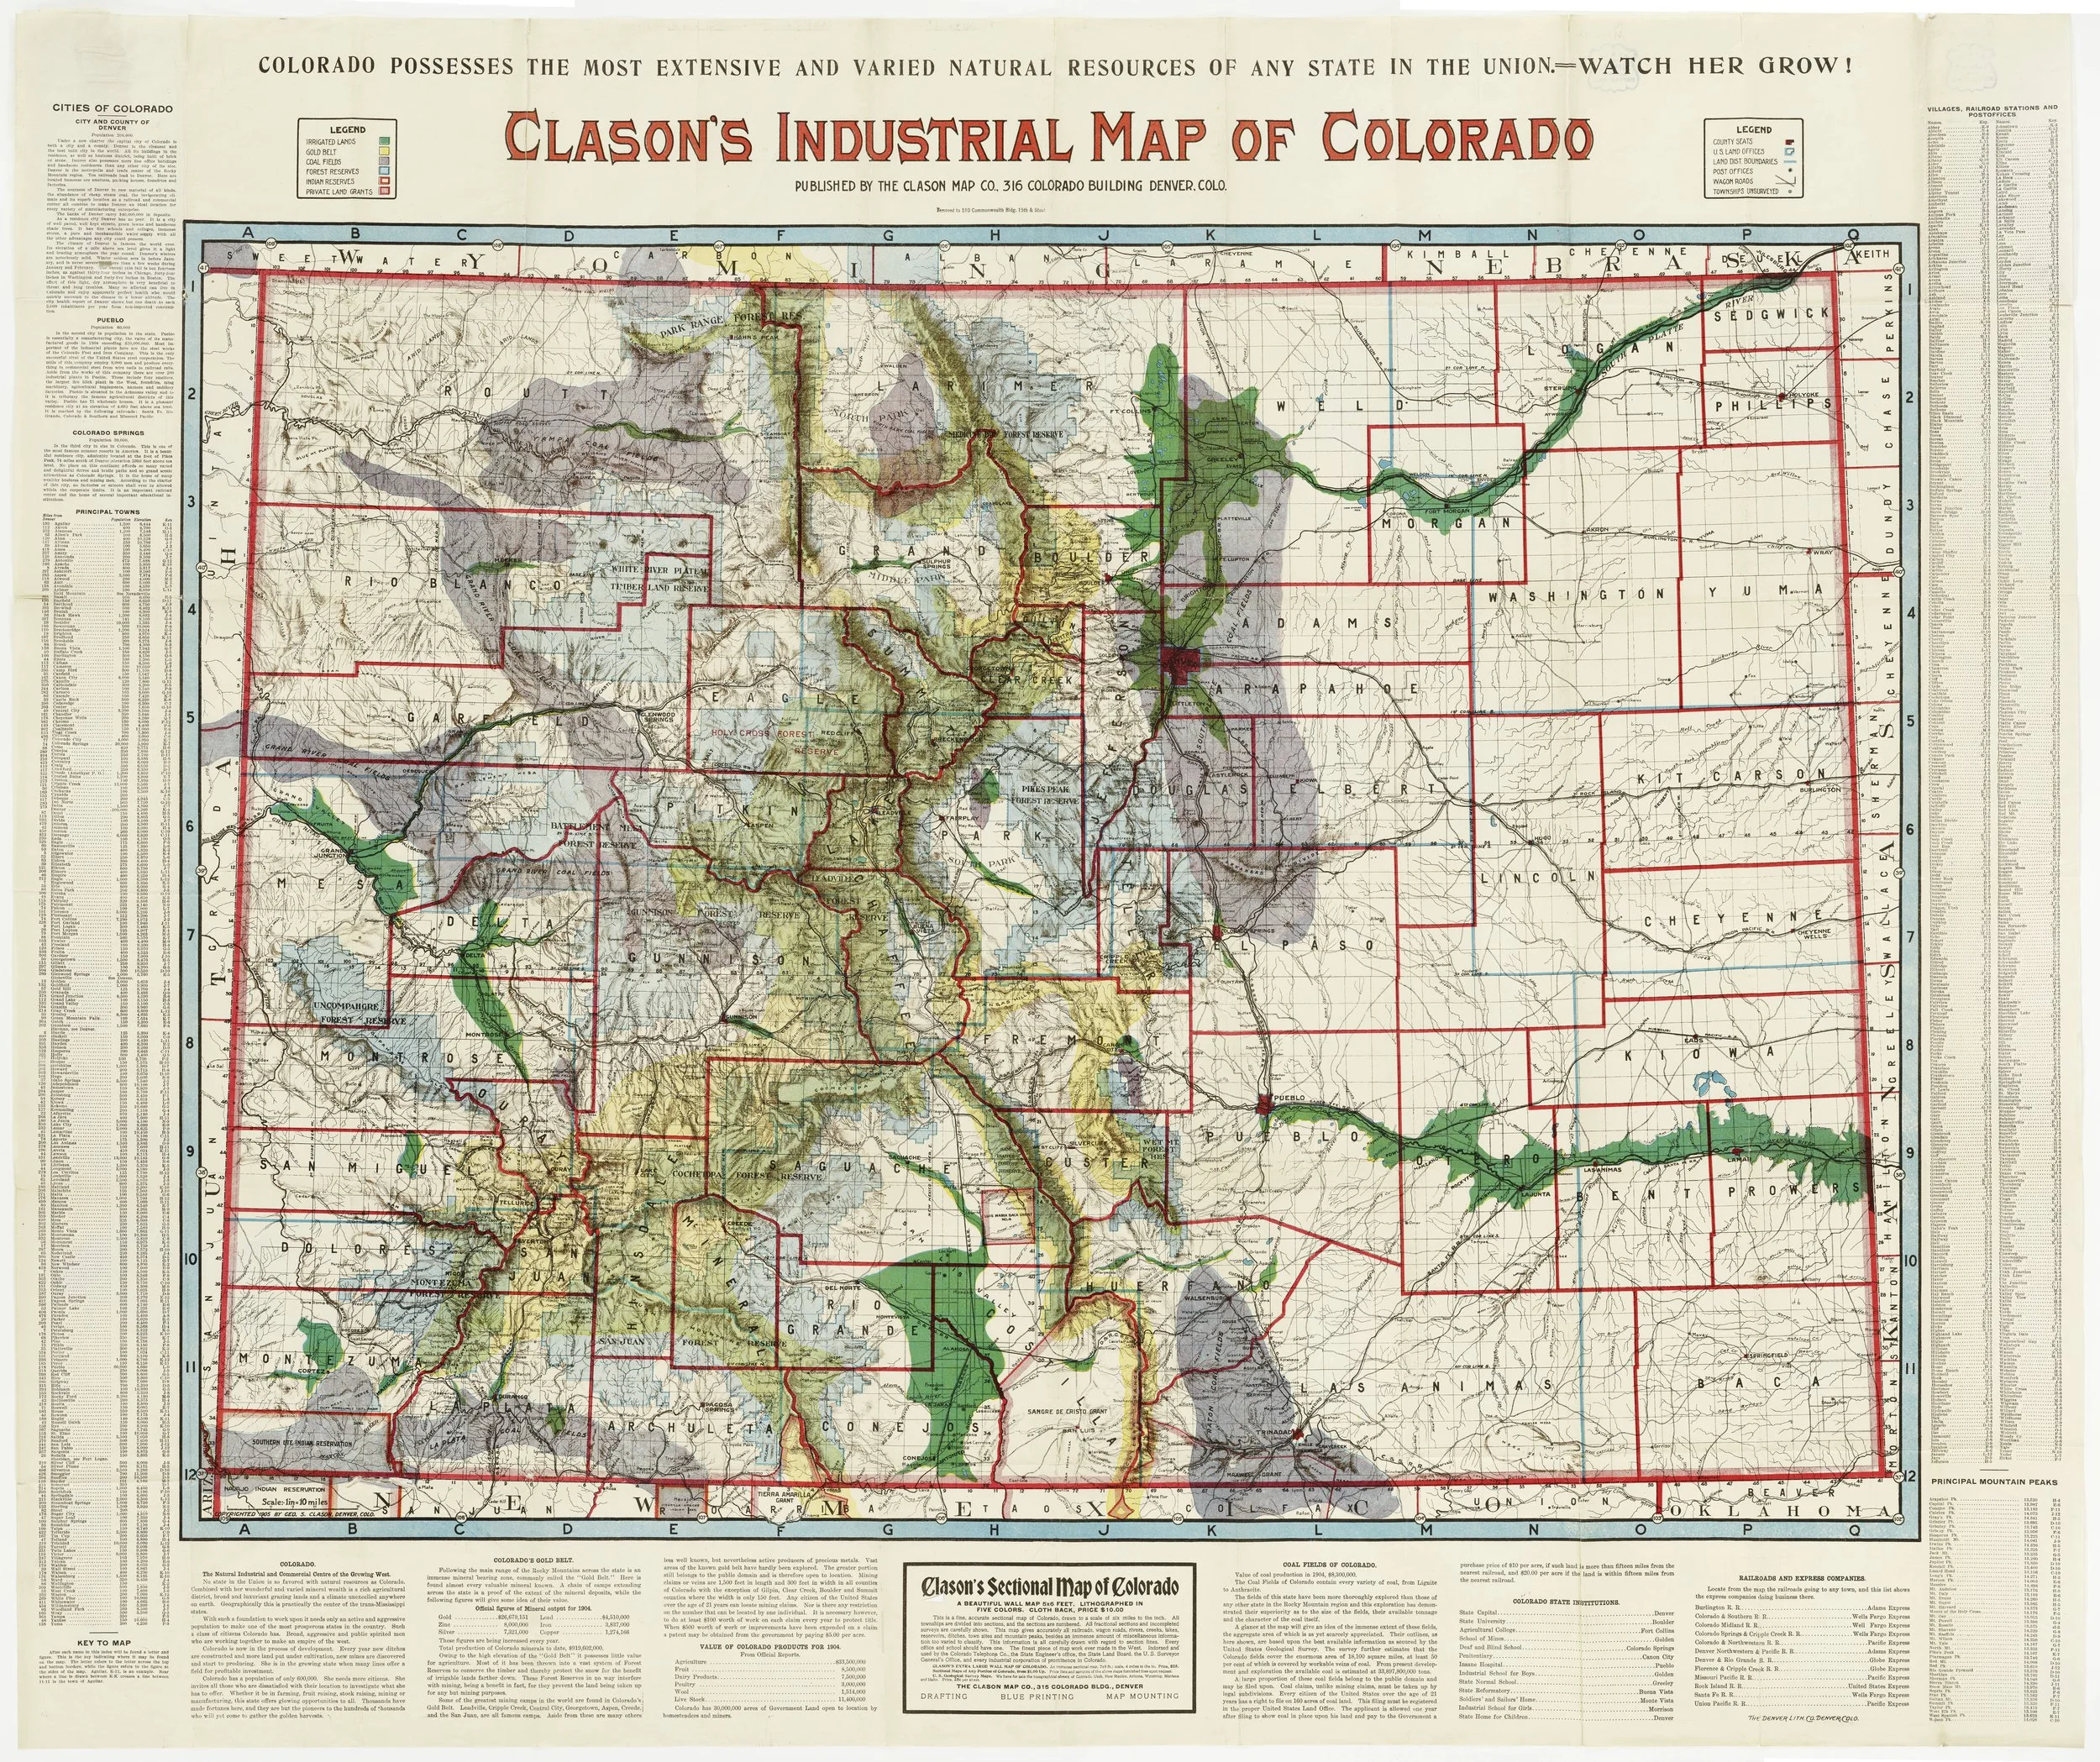
Clason Map Co., Clason’s Industrial Map of Colorado, Denver, ca. 1905. Denver Public Library via Digital Public Library of America and Wikimedia Commons. No known copyright restrictions in the United States.
The challenge was that his activity did not happen in one neat location. He operated during multiple timeframes and in different parts of Colorado, so I needed more than one version of the map. Each map had to show a different stage of the story.
Instead of manually tracing and coloring each area myself in some program (which I don’t immediately know how to do!), I used ChatGPT’s paid version in thinking mode (instant mode did not work well!). I marked the region I wanted in green on one copy of the map, then uploaded both the marked version and the clean version.
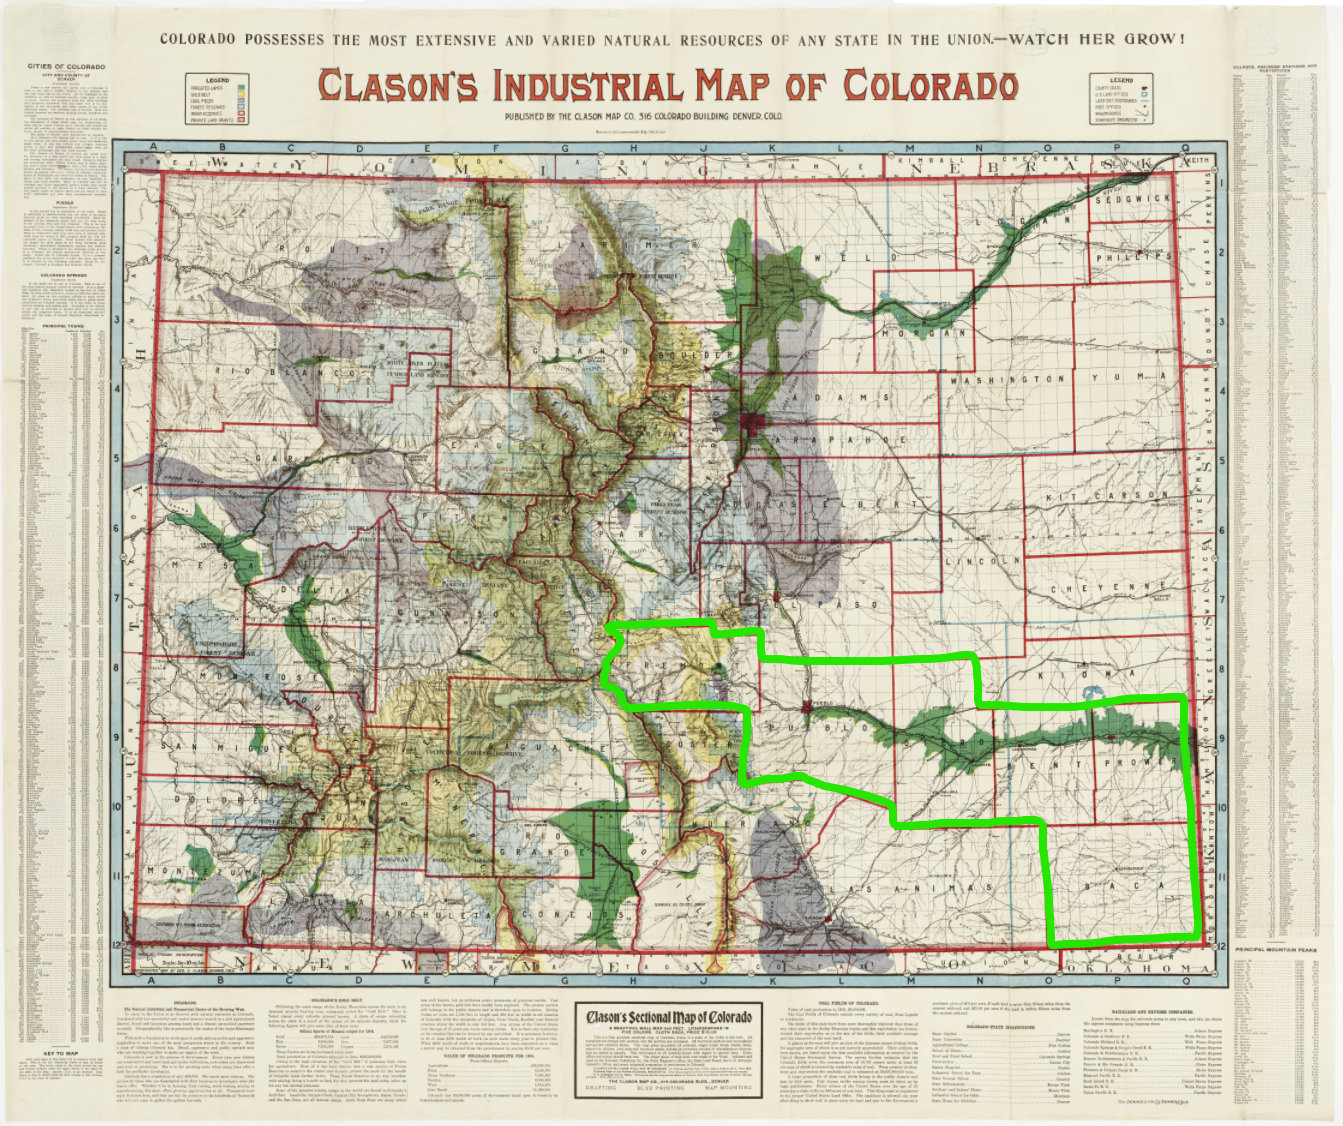
An example of one set of my outlines for one time period
My prompt was intentionally simple: “I’ve outlined a region in green on the attached map. I want you to infill that region with a red transparency on the unmarked map. Be sure to stick to the county lines as close as possible. Do not add, remove, or change any text. Only add the red transparency.”

Example of one set of maps with red transparency that it created
That was the starting point. It did not get everything right on the first try, and I did not expect it to. I usually prefer to begin with a short, plain-language prompt and then refine from there. In this case, I had to follow up with county-specific corrections, such as adding one county back in, removing another, or extending the highlight to better match the county lines.
Then I had to repeat that process for the different timeframes in the book. Each version needed a slightly different highlighted area, depending on where the events were taking place at that point in the story.
This is one of the reasons I find AI so useful for genealogy and local history work. It can help turn research into something visual and easier to understand. A map like this gives readers geographic context immediately. They can see the movement, the distances, and the changing areas of activity instead of only reading a list of place names.
It also shows an important point about using AI well. The first result does not have to be perfect. The real value often comes from the back-and-forth process: give it a clear task, review the output carefully, correct what is wrong, and keep refining until it matches the research.
For historical research, especially book projects, that kind of visual support matters. AI is not replacing the research. It is helping me present the research more clearly.
In this case, the map helps show where the story happened, not just tell it.
